Step 1
Introduction: What You Will Build
Welcome to this hands-on guide for building a full-stack, real-time cryptocurrency dashboard powered by Arkiv. In this tutorial, you'll create a backend service that fetches live crypto prices and stores them on the Arkiv network, as well as a frontend dashboard that visualizes this data using Chart.js.
The Goal
The objective is to showcase how Arkiv can serve as a decentralized data layer. Your customers will be able to view up-to-the-minute prices by querying Arkiv directly, without relying on traditional centralized APIs.
- Node.js Backend Service. A script that runs continuously, fetches Bitcoin (BTC), Ethereum (ETH), and Golem (GLM) prices from the CoinGecko API every minute, and uses the Arkiv SDK to push that snapshot to the Kaolin testnet.
- Frontend Dashboard. A static HTML, CSS, and JavaScript site that queries Arkiv, transforms the stored entities into charts, and keeps the UI refreshed in near real-time.
The Final Product
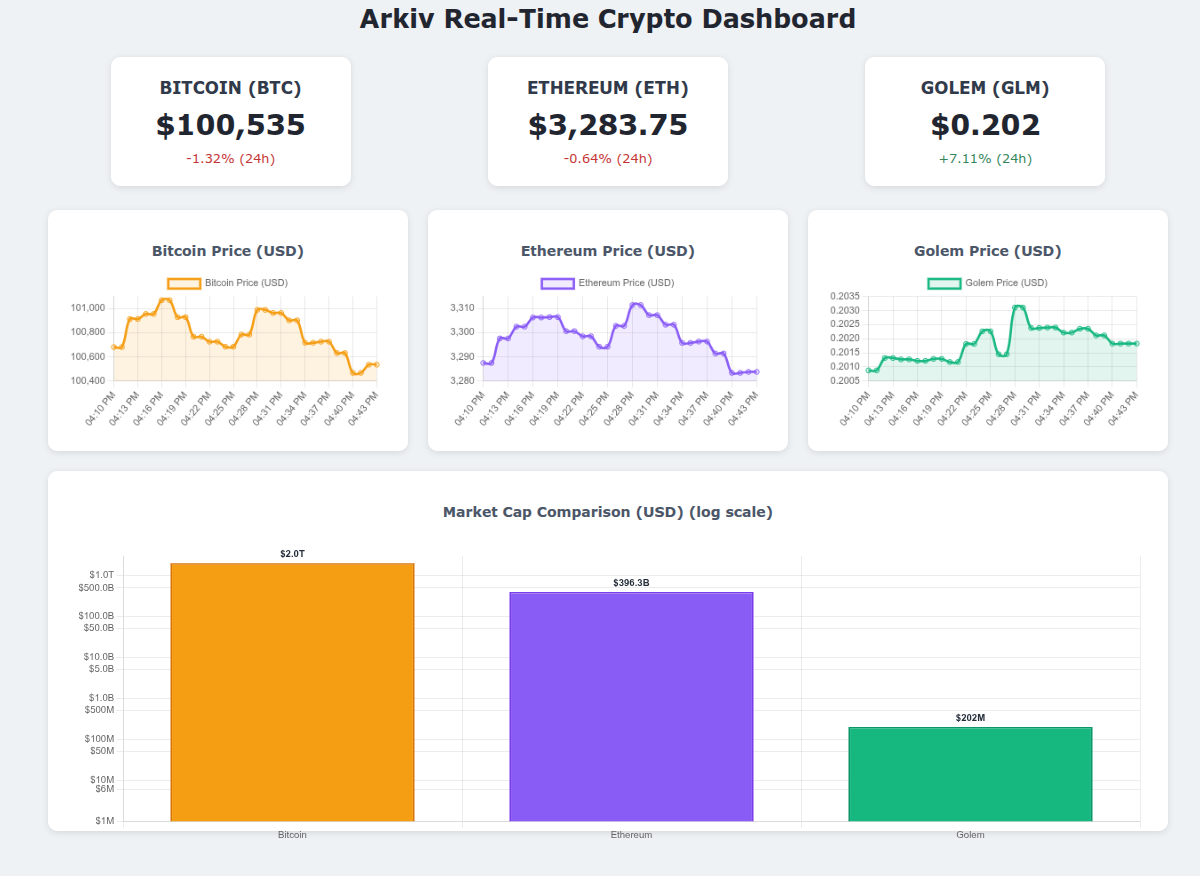
By the time you reach the end of the guide your dashboard will display:
- The latest BTC, ETH, and GLM prices.
- Minute-by-minute price changes visualized with Chart.js.
- Market capitalization cards for each token.
Preview the finished experience in the hosted demo: https://arkiv-network.github.io/learn-arkiv/_demos/fullstack-tutorial/.
Step 2
Prerequisites & Project Setup
Before writing any code, confirm your environment is ready. This project uses modern Node.js features (including the --env-file flag), and you will authenticate with Arkiv using a testnet private key.
Prerequisites
- Node.js v20.6.0 or newer.
- A comfortable text editor (VS Code is recommended).
- An Arkiv Kaolin testnet wallet with a private key.
Need a fresh private key? Run the following one-liner and store the output in a safe place.
1node -e "console.log('0x' + require('crypto').randomBytes(32).toString('hex'))"With your wallet ready, scaffold the project. The guide keeps backend and frontend code in separate folders so each side stays focused on its role.
1mkdir arkiv-dashboard
2cd arkiv-dashboard
3npm init --init-type=module -y
4npm install @arkiv-network/sdk axios
5mkdir backend frontend
6touch backend/index.js backend/.env
7touch frontend/index.html frontend/style.css frontend/script.js frontend/charts.js
Add your private key to backend/.env so the Node.js publisher can sign requests. Never commit this key to version control.
1# backend/.env
2PRIVATE_KEY=0xYOUR_PRIVATE_KEY_HERE
Your folder structure should now look like this:
1arkiv-dashboard/
2  backend/
3    .env
4    index.js
5  frontend/
6    index.html
7    charts.js
8    script.js
9    style.css
10  node_modules/
11  package-lock.json
12  package.json
Step 3
Storing Data on Arkiv
In this part, we’ll build the Node.js script that acts as our data publisher. It will fetch data from CoinGecko and use the Arkiv SDK to write it to the blockchain.
Open backend/index.js and let's build it step-by-step.
1. Imports and Client Setup
First, we need to import the necessary functions from the Arkiv SDK and set up our wallet client. This client will authenticate us with our private key, allowing us to write data.
1import { createWalletClient, http } from '@arkiv-network/sdk';
2import { kaolin } from '@arkiv-network/sdk/chains';
3import { privateKeyToAccount } from '@arkiv-network/sdk/accounts';
4import { ExpirationTime, jsonToPayload } from '@arkiv-network/sdk/utils';
5import axios from 'axios';
6
7const privateKey = process.env.PRIVATE_KEY;
8if (!privateKey) {
9  throw new Error('PRIVATE_KEY is not set in the .env file.');
10}
11
12const account = privateKeyToAccount(privateKey);
13
14const client = createWalletClient({
15  chain: kaolin,
16  transport: http(),
17  account,
18});
19
20console.log("Backend service connected as: " + client.account.address);
Run your script to see your wallet address printed in the console:
1node --env-file backend/.env backend/index.js2. Fetching Data from CoinGecko
Next, let’s add a function to call the CoinGecko API and fetch our cryptocurrency data.
1const params = new URLSearchParams({
2  vs_currency: 'usd',
3  ids: 'bitcoin,ethereum,golem',
4  sparkline: 'false',
5});
6
7const COINGECKO_URL = "https://api.coingecko.com/api/v3/coins/markets?" + params;
8
9async function fetchCryptoData() {
10  try {
11      const response = await axios.get(COINGECKO_URL);
12      console.log('Successfully fetched data from CoinGecko.');
13      return response.data;
14  } catch (error) {
15      console.error('Error fetching data from CoinGecko:', error.message);
16      return []; // Return an empty array on failure.
17  }
18}
3. Uploading Data to Arkiv
This is the core of our backend. This function takes all the crypto data and creates entities on Arkiv in a single batch operation usingmutateEntities.
- Payload: This is the main data you want to store, structured as JSON.
- Attributes: These are key-value pairs that act like tags or metadata. They are crucial for making your data queryable later.
- ExpiresIn: Entities can be set to automatically expire after a certain time.
1async function uploadDataToArkiv(cryptoData) {
2  if (cryptoData.length === 0) {
3      console.log("No crypto data to upload.");
4      return;
5  }
6
7  try {
8      // Create payload objects for all tokens
9      const createPayloads = cryptoData.map(tokenData => {
10          const {
11              id,
12              current_price,
13              market_cap,
14              price_change_percentage_24h
15          } = tokenData;
16          return {
17              payload: jsonToPayload({
18                  price: current_price,
19                  marketCap: market_cap,
20                  change24h: price_change_percentage_24h,
21                  timestamp: Date.now(),
22              }),
23              contentType: 'application/json',
24              attributes: [
25                  { key: 'token', value: id }, // 'bitcoin', 'ethereum', or 'golem'
26              ],
27              expiresIn: ExpirationTime.fromHours(3), // Data expires after 3 hours.
28          };
29      });
30
31      const result = await client.mutateEntities({
32          creates: createPayloads
33      });
34
35      // Log success for each created entity
36      result.createdEntities.forEach((entityKey, index) => {
37          const tokenId = cryptoData[index].id;
38          console.log(`Created entity for ${tokenId}. Key: ${entityKey}`);
39      });
40
41  } catch (error) {
42      console.error('Failed to create entities:', error.message);
43  }
44}
4. The Main Loop
Finally, let’s create a main loop to tie everything together. This function will fetch the data and upload all tokens in a single batch operation.
1async function runUpdateCycle() {
2  console.log('\n--- Starting new update cycle ---');
3  const cryptoData = await fetchCryptoData();
4
5  if (cryptoData.length > 0) {
6    await uploadDataToArkiv(cryptoData);
7  }
8}
9
10runUpdateCycle();
11setInterval(runUpdateCycle, 60000);
Before running the script, grab a small amount of test ETH for your wallet so it can pay gas. The Kaolin faucet and explorer are handy bookmarks while experimenting.
- Faucet: https://kaolin.hoodi.arkiv.network/faucet/
- Explorer: https://explorer.kaolin.hoodi.arkiv.network
Run the publisher with your environment file loaded:
1node --env-file backend/.env backend/index.jsYou should see logs confirming your address and the creation of entities. Leave this running. In the next section, we’ll build a frontend to see our data.
Step 4
Visualizing the Data
With the backend publishing entities every minute, the frontend can focus on reading from Arkiv and presenting the data. The dashboard sticks to vanilla HTML, CSS, and JavaScript so it is easy to deploy anywhere.
1. HTML Scaffold
First, create the skeleton of our dashboard in frontend/index.html. We need containers for the price displays and <canvas> elements for Chart.js to draw on.
Feel free to copy the full HTML markup below into your file.
1<!DOCTYPE html>
2<html lang="en">
3<head>
4    <meta charset="UTF-8">
5    <meta name="viewport" content="width=device-width, initial-scale=1.0">
6    <title>Arkiv Crypto Dashboard</title>
7    <link rel="stylesheet" href="style.css">
8</head>
9<body>
10    <h1>Arkiv Real-Time Crypto Dashboard</h1>
11
12    <div class="main-container">
13        <div id="price-container" class="price-container"></div>
14
15        <div class="charts-container">
16            <div class="chart-box">
17                <h2>Bitcoin Price (USD)</h2>
18                <canvas id="btcPriceChart"></canvas>
19            </div>
20            <div class="chart-box">
21                <h2>Ethereum Price (USD)</h2>
22                <canvas id="ethPriceChart"></canvas>
23            </div>
24            <div class="chart-box">
25                <h2>Golem Price (USD)</h2>
26                <canvas id="glmPriceChart"></canvas>
27            </div>
28        </div>
29
30        <div class="market-cap-chart">
31            <h2>Market Cap Comparison (USD) (log scale)</h2>
32            <canvas id="marketCapChart"></canvas>
33        </div>
34    </div>
35
36    <script type="module" src="charts.js"></script>
37    <script type="module" src="script.js"></script>
38</body>
39</html>2. Styling
Drop the styles below into frontend/style.css to give the dashboard a clean layout with responsive behavior on smaller screens.
1body { font-family: 'Segoe UI', Tahoma, Geneva, Verdana, sans-serif; background-color: #f0f2f5; color: #333; padding: 20px; margin: 0; }
2h1 { text-align: center; color: #1a202c; margin-bottom: 30px; }
3h2 { text-align: center; font-size: 1.1rem; color: #4a5568; margin-bottom: 15px; }
4.main-container { max-width: 1400px; margin: auto; }
5.price-container { display: flex; justify-content: space-around; flex-wrap: wrap; margin-bottom: 30px; gap: 15px; }
6.price-box { background-color: #fff; padding: 25px; border-radius: 12px; box-shadow: 0 2px 8px rgba(0,0,0,0.1); min-width: 250px; text-align: center; transition: transform 0.2s; }
7.price-box:hover { transform: translateY(-2px); box-shadow: 0 4px 12px rgba(0,0,0,0.15); }
8.price-box .token-name { font-size: 1.3rem; font-weight: bold; color: #2d3748; text-transform: uppercase; }
9.price-box .current-price { font-size: 2.2rem; margin: 12px 0; font-weight: 600; color: #1a202c; }
10.price-change { font-size: 1rem; font-weight: 500; }
11.price-change.positive { color: #2f855a; }
12.price-change.negative { color: #c53030; }
13.market-cap-chart { background-color: #fff; padding: 25px; border-radius: 12px; box-shadow: 0 2px 8px rgba(0,0,0,0.1); margin-bottom: 25px; height: 400px; }
14.charts-container { display: grid; grid-template-columns: repeat(auto-fit, minmax(450px, 1fr)); gap: 25px; margin-bottom: 25px; }
15.chart-box { background-color: #fff; padding: 25px; border-radius: 12px; box-shadow: 0 2px 8px rgba(0,0,0,0.1); }
16.explorer-link { display: inline-block; margin-top: 12px; padding: 8px 16px; background-color: #4299e1; color: white; text-decoration: none; border-radius: 6px; font-size: 0.9rem; font-weight: 500; transition: background-color 0.2s; }
17.explorer-link:hover { background-color: #3182ce; }
18@media (max-width: 768px) { .charts-container { grid-template-columns: 1fr; } .price-container { flex-direction: column; align-items: center; } }
3. Chart Helpers
Before writing our main script, let’s create a separate module to handle all chart-related operations. This keeps our code organized with Arkiv logic in script.js and chart management in charts.js. Copy and paste the following into charts.js:
1import { Chart, registerables } from 'https://cdn.jsdelivr.net/npm/chart.js@4/+esm';
2
3let marketCapChart;
4let btcPriceChart;
5let ethPriceChart;
6let glmPriceChart;
7
8function formatMarketCap(value) {
9  if (value >= 1e12) return '$' + (value / 1e12).toFixed(1) + 'T';
10  if (value >= 1e9) return '$' + (value / 1e9).toFixed(1) + 'B';
11  if (value >= 1e6) return '$' + (value / 1e6).toFixed(0) + 'M';
12  return '$' + value.toLocaleString();
13}
14
15const afterDatasetsDraw = {
16  id: 'afterDatasetsDraw',
17  afterDatasetsDraw(chart) {
18    if (chart.config.type !== 'bar') {
19      return;
20    }
21
22    const { ctx, chartArea: { top }, scales: { x, y } } = chart;
23
24    chart.data.datasets.forEach((dataset, datasetIndex) => {
25      const meta = chart.getDatasetMeta(datasetIndex);
26
27      meta.data.forEach((bar, index) => {
28        const value = dataset.data[index];
29        const text = formatMarketCap(value);
30
31        ctx.save();
32        ctx.font = 'bold 12px sans-serif';
33        ctx.fillStyle = '#1f2937';
34        ctx.textAlign = 'center';
35        ctx.textBaseline = 'bottom';
36        ctx.fillText(text, bar.x, bar.y - 5);
37        ctx.restore();
38      });
39    });
40  }
41};
42
43export function initializeCharts() {
44  Chart.register(...registerables);
45  Chart.register(afterDatasetsDraw);
46
47  const lineChartConfig = (label, color) => ({
48    type: 'line',
49    data: {
50      labels: [],
51      datasets: [{
52        label,
53        data: [],
54        borderColor: color,
55        backgroundColor: color + '20',
56        tension: 0.4,
57        fill: true,
58      }],
59    },
60    options: {
61      responsive: true,
62      maintainAspectRatio: true,
63      scales: {
64        y: { beginAtZero: false },
65      },
66    },
67  });
68
69  marketCapChart = new Chart(
70    document.getElementById('marketCapChart'),
71    {
72      type: 'bar',
73      data: {
74        labels: ['Bitcoin', 'Ethereum', 'Golem'],
75        datasets: [{
76          label: 'Market Cap (USD)',
77          data: [0, 0, 0],
78          backgroundColor: ['#f59e0b', '#8b5cf6', '#10b981'],
79          borderColor: ['#d97706', '#7c3aed', '#059669'],
80          borderWidth: 2,
81        }],
82      },
83      options: {
84        responsive: true,
85        maintainAspectRatio: false,
86        plugins: { legend: { display: false } },
87        layout: { padding: { top: 30, bottom: 10, left: 10, right: 10 } },
88        scales: {
89          y: {
90            type: 'logarithmic',
91            beginAtZero: false,
92            min: 1e6,
93            ticks: {
94              callback(value) {
95                if (value >= 1e12) return '$' + (value / 1e12).toFixed(1) + 'T';
96                if (value >= 1e9) return '$' + (value / 1e9).toFixed(1) + 'B';
97                if (value >= 1e6) return '$' + (value / 1e6).toFixed(0) + 'M';
98                return '$' + value.toLocaleString();
99              },
100            },
101          },
102        },
103      },
104    }
105  );
106
107  btcPriceChart = new Chart(
108    document.getElementById('btcPriceChart'),
109    lineChartConfig('Bitcoin Price (USD)', '#f59e0b')
110  );
111  ethPriceChart = new Chart(
112    document.getElementById('ethPriceChart'),
113    lineChartConfig('Ethereum Price (USD)', '#8b5cf6')
114  );
115  glmPriceChart = new Chart(
116    document.getElementById('glmPriceChart'),
117    lineChartConfig('Golem Price (USD)', '#10b981')
118  );
119}
120
121export function updateChart(chart, data, priceKey) {
122  const labels = data
123    .map((d) => {
124      const date = new Date(d.timestamp);
125      return date.toLocaleTimeString([], { hour: '2-digit', minute: '2-digit' });
126    })
127    .reverse();
128  const prices = data.map((d) => d[priceKey]).reverse();
129
130  chart.data.labels = labels;
131  chart.data.datasets[0].data = prices;
132  chart.update();
133}
134
135export function updateMarketCapChart(btcData, ethData, glmData) {
136  const latestValues = [
137    btcData.length > 0 ? btcData[0].marketCap : 0,
138    ethData.length > 0 ? ethData[0].marketCap : 0,
139    glmData.length > 0 ? glmData[0].marketCap : 0,
140  ];
141
142  marketCapChart.data.datasets[0].data = latestValues;
143  marketCapChart.update();
144}
145
146export function updatePriceBoxes(btcData, ethData, glmData) {
147  const container = document.getElementById('price-container');
148  container.innerHTML = '';
149
150  const tokens = [
151    { name: 'Bitcoin', data: btcData, symbol: 'BTC' },
152    { name: 'Ethereum', data: ethData, symbol: 'ETH' },
153    { name: 'Golem', data: glmData, symbol: 'GLM' },
154  ];
155
156  tokens.forEach((token) => {
157    if (token.data.length === 0) {
158      return;
159    }
160
161    const latest = token.data[0];
162    const priceChange = latest.change24h || 0;
163    const changeClass = priceChange >= 0 ? 'positive' : 'negative';
164    const changeSign = priceChange >= 0 ? '+' : '';
165    const explorerUrl = 'https://explorer.kaolin.hoodi.arkiv.network/entity/' + latest.entityKey + '?tab=data';
166
167    const box = document.createElement('div');
168    box.className = 'price-box';
169    box.innerHTML = [
170      '<div class="token-name">' + token.name + ' (' + token.symbol + ')</div>',
171      '<div class="current-price">$' + latest.price.toLocaleString() + '</div>',
172      '<div class="price-change ' + changeClass + '">',
173      '    ' + changeSign + priceChange.toFixed(2) + '% (24h)',
174      '</div>',
175      '<a href="' + explorerUrl + '" target="_blank" class="explorer-link">View on Arkiv Explorer -></a>',
176    ].join('\n');
177
178    container.appendChild(box);
179  });
180}
181
182export function getCharts() {
183  return { marketCapChart, btcPriceChart, ethPriceChart, glmPriceChart };
184}4. Client Setup and Imports
In script.js, start by importing the Arkiv SDK and chart functions. Set your wallet address at the top so we only fetch entities you created. Because this is a browser environment, we import the SDK directly from a CDN.
1const USER_ADDRESS = '0xYourAddressHere';
2
3if (!USER_ADDRESS || USER_ADDRESS === '0xYourAddressHere') {
4  alert('Please set your USER_ADDRESS in script.js to your wallet address!');
5  throw new Error('USER_ADDRESS not configured');
6}
7
8import { createPublicClient, http } from 'https://esm.sh/@arkiv-network/sdk@0.6.0?target=es2022&bundle-deps';
9import { eq } from 'https://esm.sh/@arkiv-network/sdk@0.6.0/query?target=es2022&bundle-deps';
10import { kaolin } from 'https://esm.sh/@arkiv-network/sdk@0.6.0/chains?target=es2022&bundle-deps';
11import { initializeCharts, updateChart, updateMarketCapChart, updatePriceBoxes, getCharts } from './charts.js';
12
13const client = createPublicClient({
14  chain: kaolin,
15  transport: http(),
16});
17
18console.log('Arkiv client initialized for address:', USER_ADDRESS);
5. Fetching Data from Arkiv
Now add the query function that fetches entities from Arkiv. Notice we query by the token attribute our backend set (e.g., 'bitcoin', 'ethereum', 'golem') and filter by .ownedBy() to only get your entities.
1async function fetchTokenDataFromArkiv(tokenId) {
2  const query = client.buildQuery();
3  const result = await query
4    .where(eq('token', tokenId))
5    .ownedBy(USER_ADDRESS)
6    .withPayload(true)
7    .fetch();
8
9  return result.entities
10    .map((entity) => ({ ...entity.toJson(), entityKey: entity.key }))
11    .sort((a, b) => new Date(b.timestamp).getTime() - new Date(a.timestamp).getTime());
12}
6. Putting It All Together
Finally, implement the updateUI function that fetches data for all three tokens, updates the price boxes, market cap chart, and individual price charts. Set this to run on page load and then every 15 seconds to keep the dashboard fresh.
1async function updateUI() {
2  try {
3    const [btcData, ethData, glmData] = await Promise.all([
4      fetchTokenDataFromArkiv('bitcoin'),
5      fetchTokenDataFromArkiv('ethereum'),
6      fetchTokenDataFromArkiv('golem'),
7    ]);
8
9    if (btcData.length > 0 || ethData.length > 0 || glmData.length > 0) {
10      updatePriceBoxes(btcData, ethData, glmData);
11      updateMarketCapChart(btcData, ethData, glmData);
12
13      const { btcPriceChart, ethPriceChart, glmPriceChart } = getCharts();
14      if (btcData.length > 0) {
15        updateChart(btcPriceChart, btcData, 'price');
16      }
17      if (ethData.length > 0) {
18        updateChart(ethPriceChart, ethData, 'price');
19      }
20      if (glmData.length > 0) {
21        updateChart(glmPriceChart, glmData, 'price');
22      }
23
24      console.log('UI updated successfully');
25    }
26  } catch (error) {
27    console.error('Error updating UI:', error);
28  }
29}
30
31window.addEventListener('DOMContentLoaded', () => {
32  initializeCharts();
33  updateUI();
34  setInterval(updateUI, 15000);
35});
Step 5
Running the App & Next Steps
With both halves built, it is time to run everything together. Start the backend first so new entities show up while you preview the dashboard, then launch a simple static server for the frontend.
1. Run the Backend
From the backend directory, load your environment file and start the publisher. Leave this process running—each minute it will push a new snapshot to Arkiv.
1node --env-file .env index.js2. Serve the Frontend
You can’t open index.html directly from your file system due to browser security policies. You must serve it using a local web server. The easiest way is with npx serve.
In the arkiv-dashboard/frontend directory, run:
1npx serve3. View the Dashboard
Open the localhost URL printed by serve (usually http://localhost:3000). Within about a minute you should see live price cards, chart updates, and links to the Arkiv Explorer for each entity.
Summary
Congratulations! You have successfully built a full-stack, decentralized application.
- You created a Node.js backend that acts as a data publisher, writing real-time information as entities to the Arkiv blockchain.
- You built a vanilla JS frontend that acts as a data consumer, querying the Arkiv blockchain with a public client and visualizing the results.
- You learned the fundamentals of the Arkiv SDK, including
createWalletClientfor writing,createPublicClientfor reading, and the query builder for filtering data.
Next steps
This project is a great starting point. Here are some ideas to expand on what you’ve learned:
- Add more tokens: Modify the backend and frontend to support more cryptocurrencies.
- Display more data: The CoinGecko API provides a wealth of data. Try adding trading volume or 7-day price changes.
- More complex queries: Experiment with Arkiv’s query builder to filter data by time ranges or other parameters.
- Deploy it: Deploy the frontend to a static hosting service like Vercel or Netlify so anyone can view your dashboard.
The full source code for this guide is available on GitHub: More information.